さっそく完成系

terraria docker compose 構築メモ
docker compose で立ち上げるメモ
続きを読むETS2の走破率100%を達成した / デバッグモード設定をメモ
ついにETS2の実績全解除を達成した
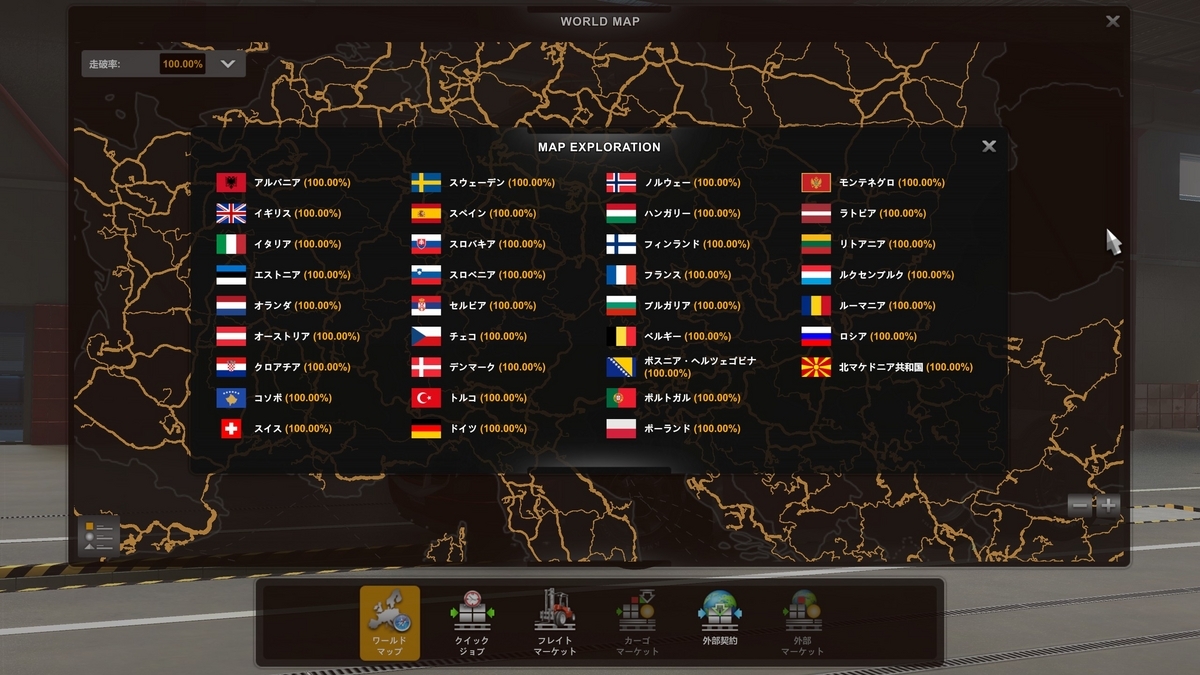
ETS2 Going Camping 実績
わかりにくい実績だったので記事にしておく
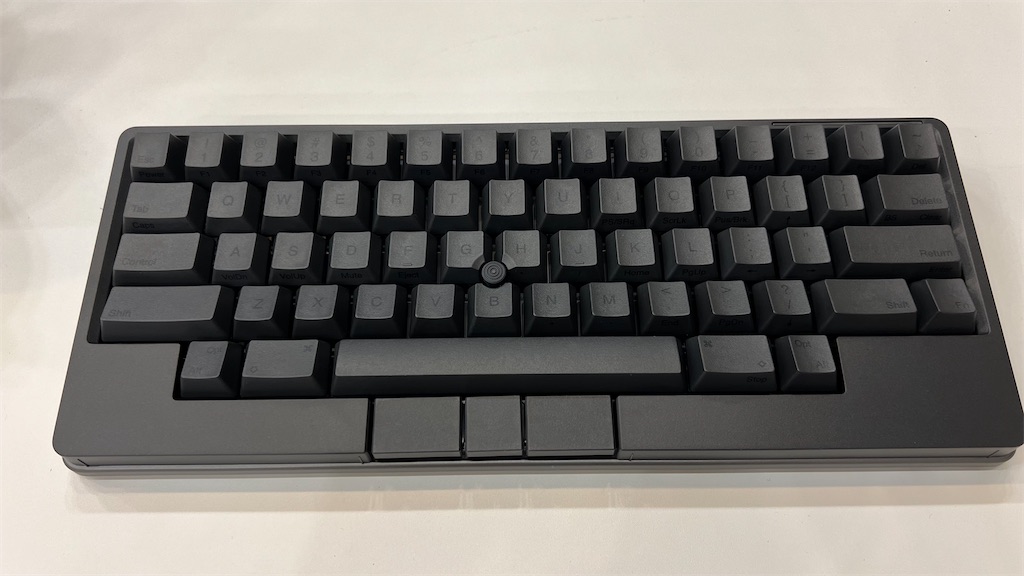
続きを読むHHKB meetupに参加してHHKB Studioを発売日から1週間使っておすすめしない話
HHKB n個目の購入となりました こんにちは
vlcでdlnaが表示されない問題
結論: ネットワークアダプタの「イーサネット」の名前を日本語から変更
続きを読む